
Profiling: where a request's time goes, and what was fixed
Profiled on 2026-09-28 against origin/main at 483d902: sampled stacks, allocation counts and throughput for the six hot paths the polish brief lists. Three changes came out of it. Together they cut app CPU per request by 32–39% on pages that don't touch the database and by 50% on signed-in pages, which is 1.4–1.5× and 2.0–2.1× the req/s on the same 4 cores (table at the end). Everything else found is listed too, with why it stayed.
Method
- Host: a 24-thread Linux workstation, Ryzen AI 9 HX 370 (12 cores: 4 Zen 5 + 8 Zen 5c, SMT), 93 GB RAM, Arch Linux, Rust 1.98.1. Docker isn't usable by this user there, so the release binary runs directly.
- App: release build of a
git archiveof the commit,LOCO_ENV=production, client-side rendering,COMPRESSION=false,LOG_LEVEL=error, a fresh SQLite database per run. Pinned withtasksetto 4 logical CPUs with no SMT siblings in the set, so tokio runs 4 workers. - Load:
oha1.16 on a separatetaskset, 32 connections, keep-alive, no compression, no redirect following. A 2 s warm-up, then 8 s measured per path. - CPU layout. Logical CPU n and n+12 share a physical core. Cores 0–3 (Zen 5) share one L3, and cores 4–11 (Zen 5c) share the other. The profiles and experiment runs 1–2 pinned the app to 4–7 and oha to 0–3,12–15 on an otherwise idle host. Partway through, another agent started building loco-rs on the same host. It was then pinned to cores 8–11 (logical 8–11,20–23), which still share the L3 with 4–7. So the final before/after moved the app to cores 0–3 (its own L3) and oha to 4–7,16–19. That run had the other build going on cores 8–11 throughout (it shares memory bandwidth with ours, and oha's L3), which is why its ranges are wide. The runner checked before each round that our 16 logical CPUs were idle (under 5% busy over 3 s).
- Paths:
GET /up,GET /sign_inas HTML and as an Inertia XHR,GET /dashboardsigned in (HTML and XHR), andPATCH /settings/profile(Inertia XHR with CSRF token, answered with a 303). This profile predates organizations;/dashboardis now a redirect, sobench/profile.shloads the account overview/{account_slug}instead (account_html,account_xhr).POST /sign_inspends its time in argon2 by design (the password hash), which dominates everything else, so it wasn't profiled further. - Harness:
bench/profile.shboots the binary, signs up a user, then loads each path. It records req/s, latency, and app CPU per request (the server's utime+stime from/proc/<pid>/statover the run, divided by requests served). CPU/request is the steadier number: it doesn't depend on how much CPU the load generator gets. - A/B: every before/after comparison is 3–5 rounds, alternating the order of the builds within each round. Cells show the median (min–max) across rounds.
Sampling and allocation counts
perf_event_paranoid is 2 on that host and there's no sudo, so perf and samply can't attach. Instead a separate profiling build swaps src/bin/main.rs for bench/profiling_main.rs (not compiled as part of the app), which:
- runs pprof-rs (
setitimer+ signal-based sampling at 1,999 Hz, no privileges needed) when a control file appears, and writes folded stacks when it's told to stop; and - wraps mimalloc in a counting
GlobalAlloc. Counting is gated by an env var so its atomics don't show up in the sampled profiles;PROF_CTL=allocsturns it on.
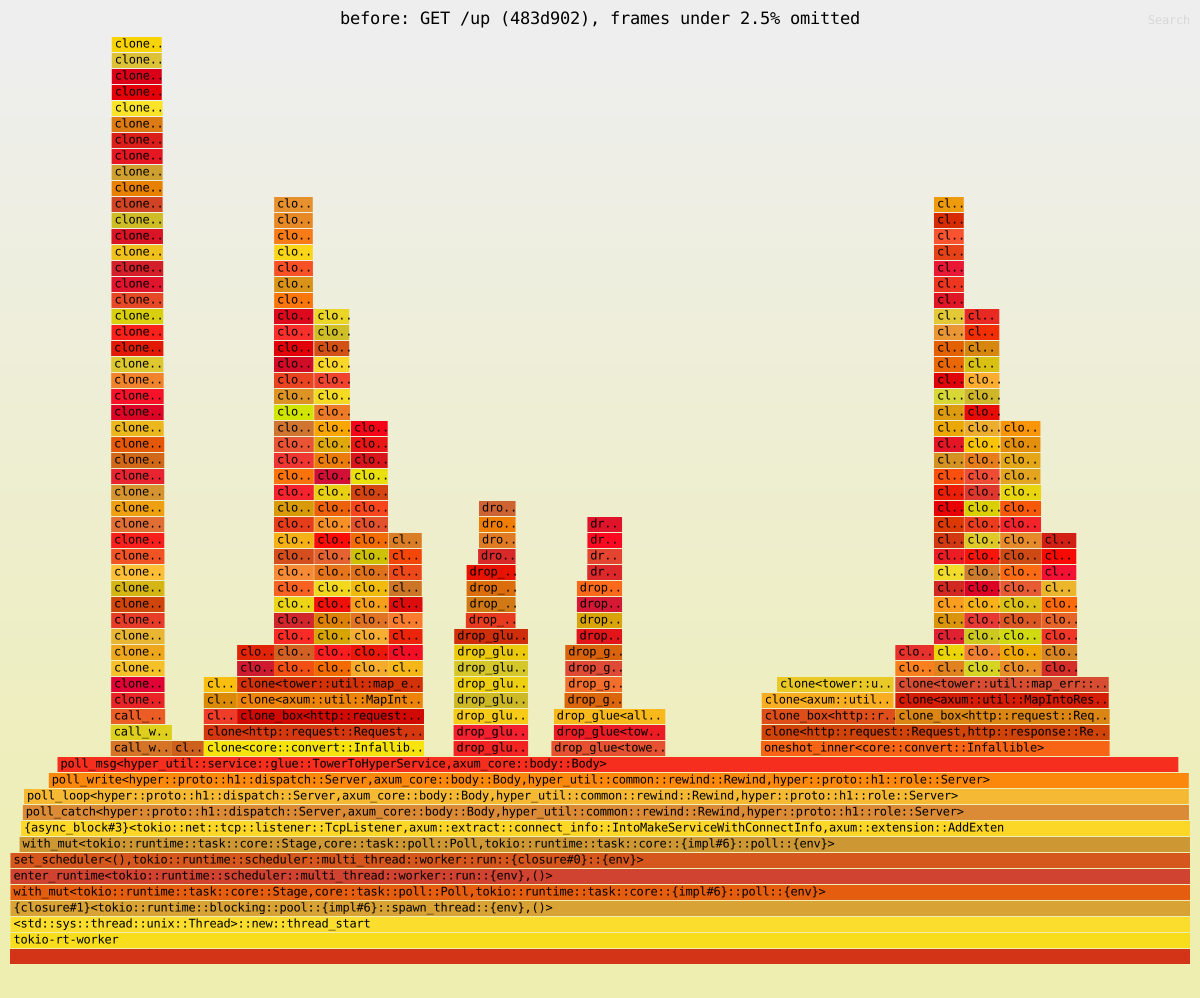
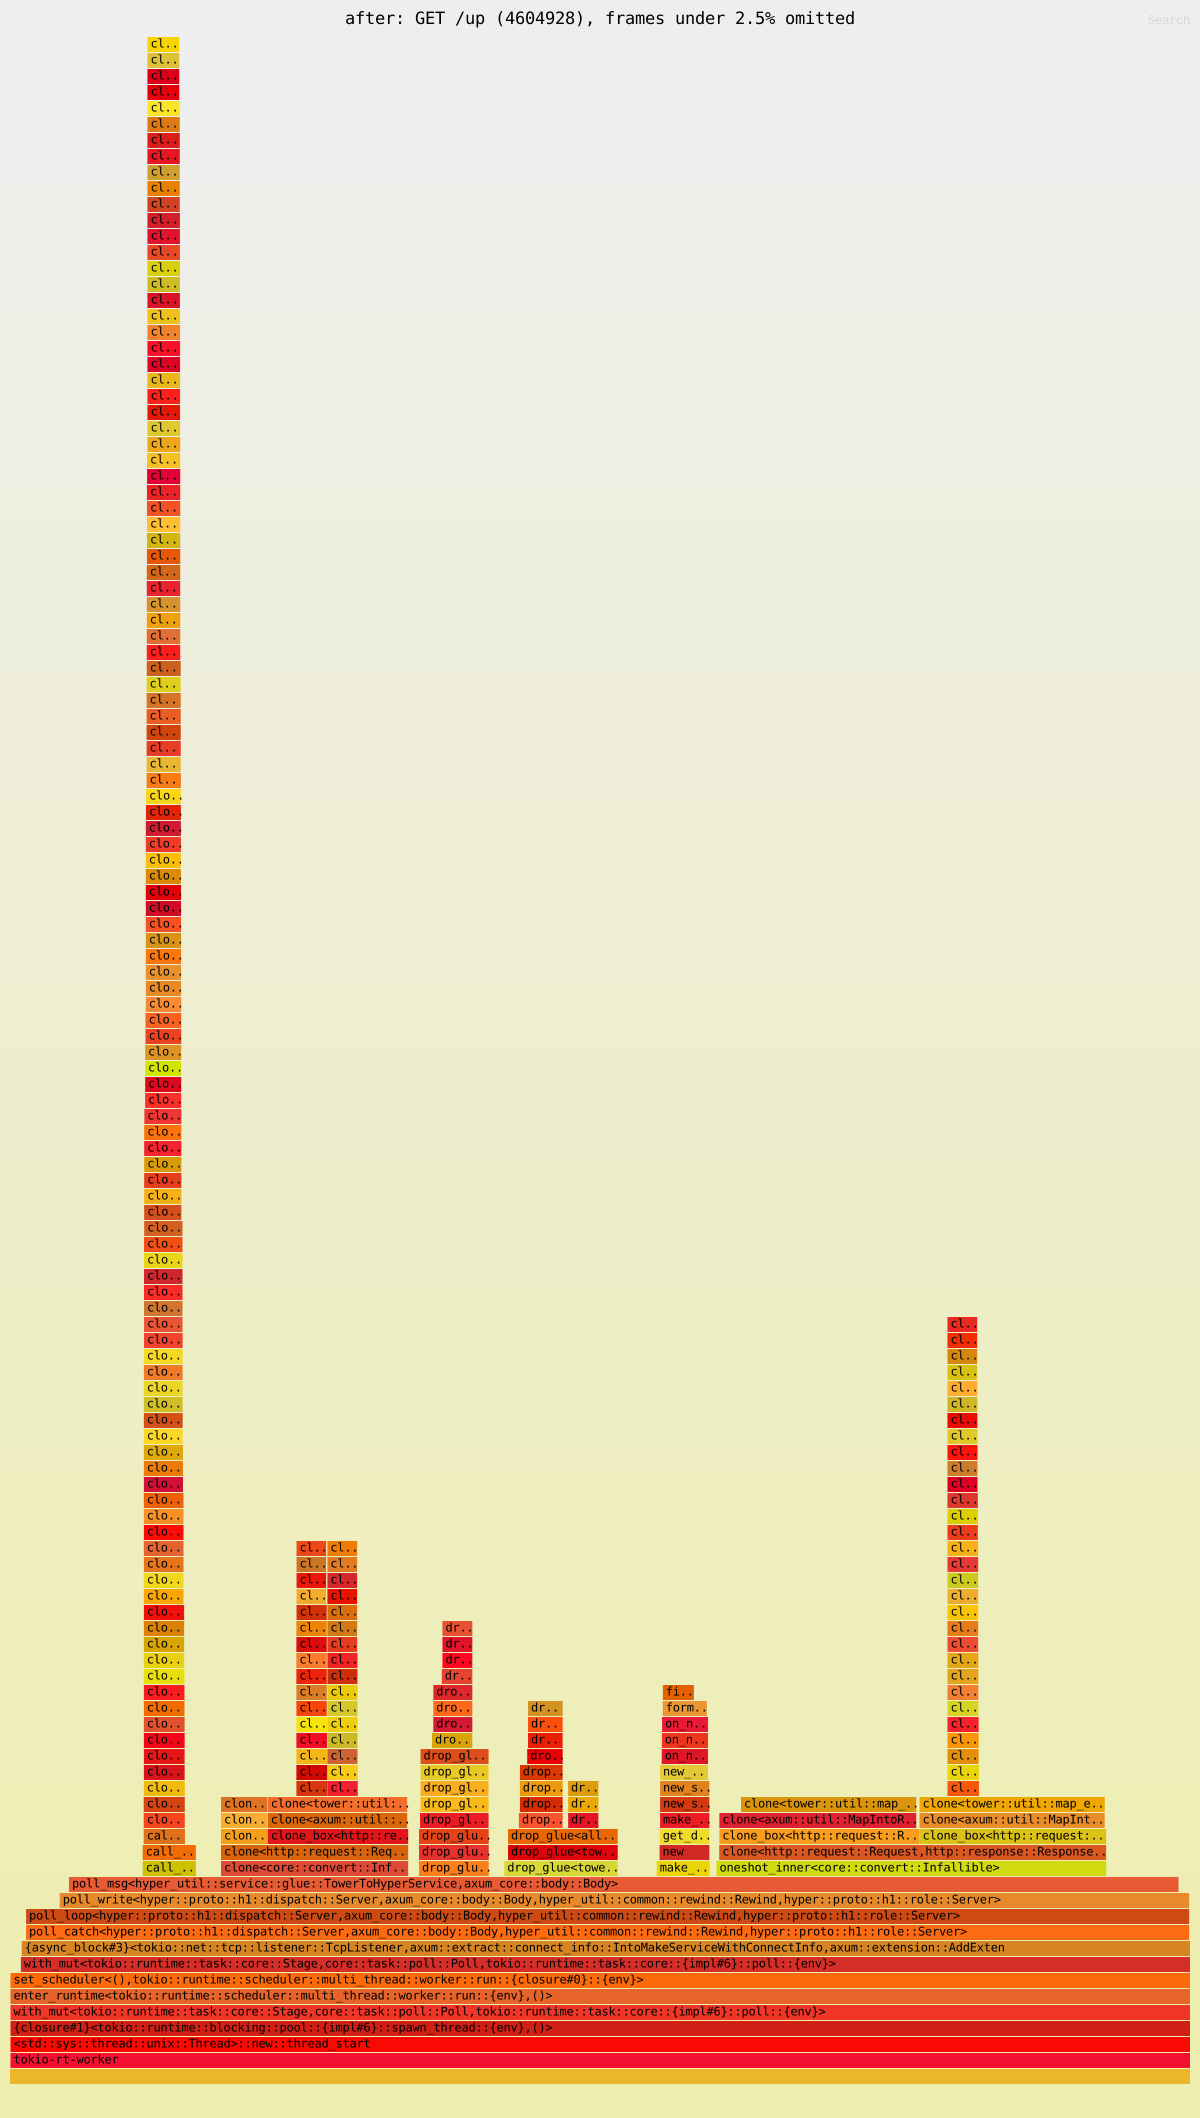
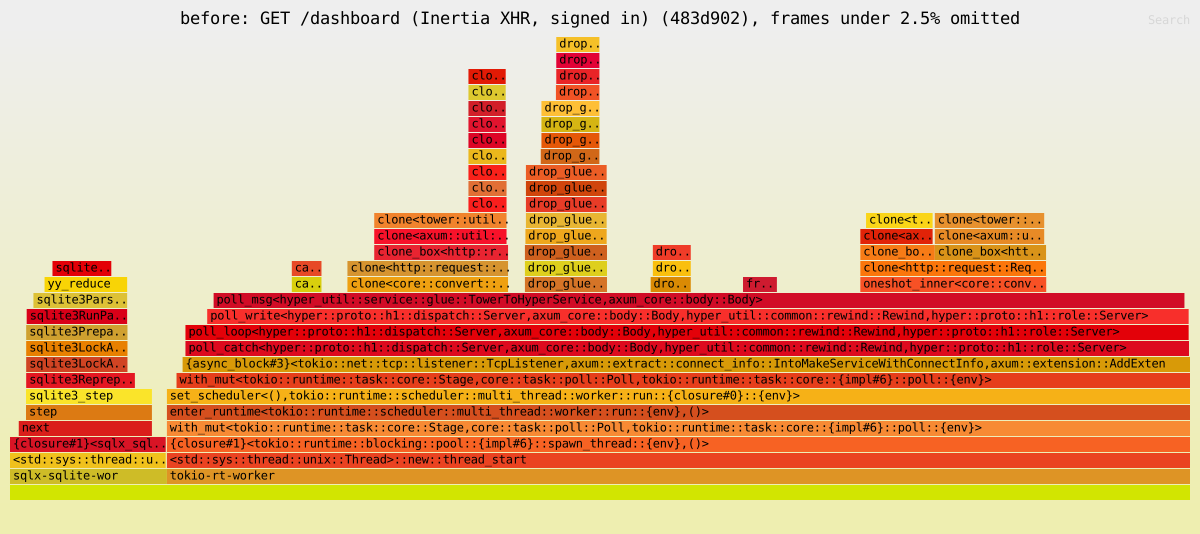
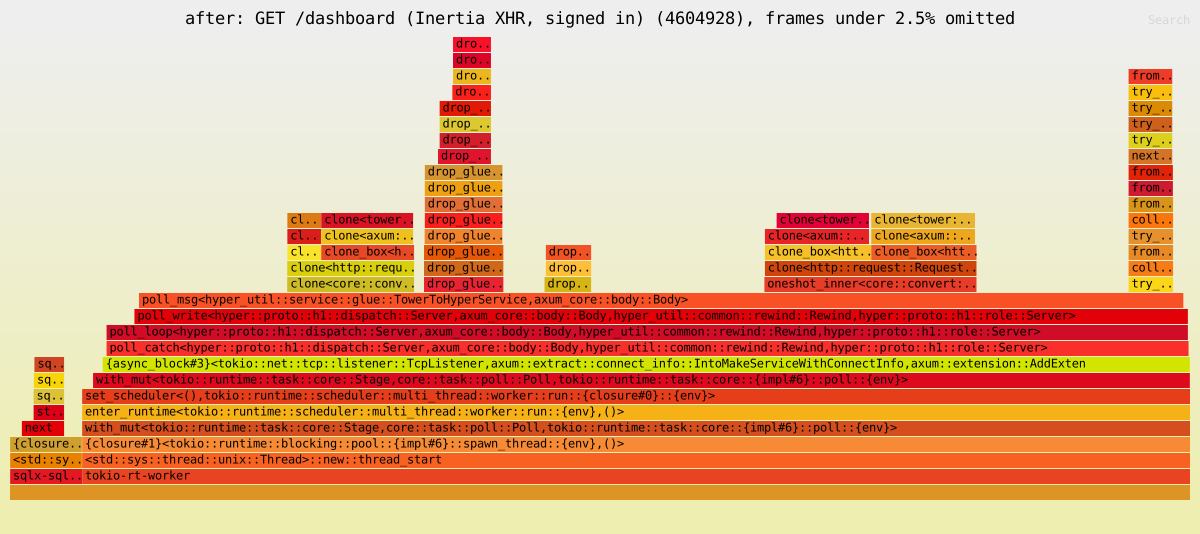
PROF_CTL=1 bench/profile.sh BIN OUT drives the sampling, and PROF_CTL=allocs the counting. bench/profile_report.py turns the folded stacks into the tables below and writes shortened stacks for inferno-flamegraph. The flamegraphs in docs/profiling/ are /up and signed-in /dashboard (XHR), before and after. Frames under 2.5% of samples are dropped and runtime plumbing (poll, call_once, …) is collapsed, which keeps each SVG under 100 KB.
What a request cost before
483d902, sampled at 1,999 Hz for 8 s per path under full load. Each sample is charged to the first bucket that matches any frame of its stack.
| Bucket | /up | /sign_in HTML | /dashboard XHR | profile PATCH |
|---|---|---|---|---|
Cloning AppContext (layer + handler state, incl. the allocations it makes) | 50.2% | 44.5% | 28.9% | 20.5% |
| SQLite / sqlx / sea-orm | 1.7% | 1.2% | 25.2% | 42.4% |
| hyper, tokio, syscalls, axum routing, drops | 27.3% | 29.2% | 21.5% | 20.2% |
| mimalloc self time, outside the buckets above | 10.5% | 10.2% | 12.9% | 10.2% |
| cookie keys, HMAC, AES | 7.2% | 6.3% | 6.9% | 5.1% |
| tracing / request log | 3.2% | 3.4% | 2.1% | 1.5% |
| page JSON + HTML document | – | 4.0% | 1.8% | 0.1% |
Allocations per request (profiling build, counting on):
/up | /sign_in HTML | /sign_in XHR | /dashboard HTML | /dashboard XHR | PATCH | |
|---|---|---|---|---|---|---|
| allocations | 1,906 | 2,075 | 2,016 | 2,489 | 2,359 | 2,268 |
| bytes allocated | 220 KB | 260 KB | 252 KB | 322 KB | 306 KB | 307 KB |
Nearly 2,000 allocations and 220 KB to answer /up with OK is what gave it away.
Findings
| # | What | Where | Cost (before) | Status |
|---|---|---|---|---|
| 1 | AuthState held a whole AppContext, and axum's from_fn_with_state clones its state on every request. AppContext clones Config, whose settings is a raw serde_json::Value (the whole settings: block, an IndexMap tree): ~0.9 µs and 42 allocations per clone, measured in isolation. | src/auth.rs:46 | the settings JSON clone alone: 11.3% of /up samples, 6.8% of /dashboard (the allocator work it causes is charged elsewhere) | Fixed: the state is now { db: DatabaseConnection, settings }. /up +65% req/s, CPU/request −40% (run 1, E1); allocations per request −552 on every path (below). |
| 2 | SQLite re-prepared SELECT … LIMIT ? on every call. sea-orm's .one() appends LIMIT ? and binds 1. SQLite's planner looks at a bound LIMIT (sqlite3ExprIsInteger → sqlite3VdbeSetVarmask), so binding it again expires the statement, and sqlite3_step re-parses and re-plans it (sqlite3Reprepare). sqlx's statement cache was hit and then thrown away. The session+user lookup behind every signed-in request is a .one(). | src/models/sessions.rs:110 and the 6 other .one() calls in src/models/ | 8.8–9.2% of /dashboard samples inclusive, and much more in effect: fixing it cut /dashboard CPU/request by ~40% | Fixed in the app: db::First (src/db.rs) adds .first(db), which runs the query without a LIMIT and takes the first row. All 7 lookups are by a unique key (id, token, email), so they match at most one row anyway. E6 changed only the session lookup (the one on the request path): /dashboard XHR +107% req/s over E1 in the same run, CPU/request −50% (run 3). The final build uses .first() in all 7 places. tests/db.rs counts SQLite's SQLITE_STMTSTATUS_REPREPARE across 5 session lookups on one connection: 0 now, and 5 with .one() put back. |
| 3 | Cookie keys were derived on every request. The flash and CSRF layers each call derive_key (2× HMAC-SHA256 of secret_key_base), and the session cookie is a third on signed-in requests. | src/inertia/cookies.rs:34-44, called from flash.rs:67, csrf.rs:177, cookies.rs:144 | 4.7–4.9% of unauthenticated requests | Fixed: derived once per Settings (Settings::cookie_keys, a OnceLock). /up and /sign_in +4–5% (run 2, E5). A test checks the cached keys equal a fresh derivation. |
| 4 | Every route handler's state is a whole AppContext too. axum's HandlerService clones its state on every call. That's Loco's router: AppRoutes::to_router calls .with_state(ctx), and every handler taking State<AppContext> needs it. | Loco controller/app_routes.rs:310 | the settings JSON clone via handler state: 22.8% of /up samples before, 32.5% after (the same cost, a bigger share of a smaller total) | Not fixed. The cost is Config::settings again: an experiment that sets ctx.config.settings = None after Settings is parsed (E2) gave another +49% on /up over finding 1 alone and −36% CPU/request. It's not committed because the only safe way to do it is fragile: Loco's CLI boots the context twice (cli.rs:777 and again in create_app, cli.rs:799), passing app_context.config on, so clearing it in after_context breaks the second boot. The experiment had to stash the raw JSON in a static to survive that. Loco's documented config recipe also reads ctx.config.settings at request time, so a kit that silently empties it would surprise the next reader. The real fix belongs upstream (an Arc<Config> in AppContext, or settings behind an Arc); worth an issue on loco-rs. |
| 5 | Our six layers wrap every route separately. Router::layer in after_routes applies the layer to each route (axum clones the layer stack per route), so each request clones the handler's state through each layer's BoxCloneSyncService. | src/app.rs:97-104 | inside finding 4 | Not fixed. Wrapping the router in one fallback_service first (E3) made /up +7% over finding 1 but made /dashboard and PATCH no better, and it changes where MatchedPath/OriginalUri are set for every layer. Not worth the risk for 7% on the cheapest path. |
| 6 | request_id (UUID + regex clean-up) | Loco request_id.rs | 0.1% self (45% inclusive only because it wraps the whole stack) | Not a cost. |
| 7 | Request logger (RedactedSpan, redact_uri) at LOG_LEVEL=error | src/inertia/request_log.rs:99 | 0.7–1.4% self; all tracing frames 1.5–3.4% | Not worth it. The span is built even when nothing is logged, which is tower-http's TraceLayer behaviour. At info it would cost more; that's what LOG_LEVEL is for. |
| 8 | CSP header string + nonce (format! ×5, 16 random bytes) | src/inertia/headers.rs:31-67 | 0.2–0.6% | Not worth it. The nonce has to be per request; caching the policy template saves a few string pushes. |
| 9 | Vite tags rebuilt per HTML render (manifest walk + format!) | src/inertia/vite.rs:108 | 0.9–1.5% of HTML pages, 0 for XHR | Not worth it. Could be precomputed with a nonce placeholder, but that's more code for ~1%. |
| 10 | Document::render + script_safe_json | src/inertia/document.rs:65 | 0.5% | Not a cost. |
| 11 | vite::shared takes a Mutex and clones a 3-string cache key on each call (2–3 per render) | src/inertia/vite.rs:194 | not visible (<0.1%) | Not a cost at 4 cores. |
| 12 | Inertia extractor clones the request Parts (headers + extensions) | src/inertia/render.rs:68 | not visible (<0.1%) | Not a cost. |
| 13 | Loco's ETag layer | Loco etag.rs | ~0 | Not a cost: it only compares an ETag the handler already set with If-None-Match. It never hashes bodies. |
| 14 | DB round trips per signed-in request | src/models/sessions.rs:103 | – | Already one query: session and user come from one JOIN (find_also_related). The profile PATCH is two: that lookup and the UPDATE (sea-orm's update on SQLite uses RETURNING, so no re-read). |
| 15 | Params extractor (query + body into a serde_json::Map, then into the struct) | src/controllers/mod.rs:71 | 0.1% of PATCH | Not a cost. (The handler future as a whole is 22.6%, 4.9% of it the UPDATE.) |
| 16 | Pool size vs load | config/production.yaml:89 | – | max_connections: 10 for 4 tokio workers. Pool acquire is 1.4–2.5% of on-CPU samples on the DB paths, and no request failed or timed out acquiring in the before/after runs. (A sampling profiler doesn't show time spent waiting, so wait time wasn't measured.) SQLite serialises writers anyway, so more connections wouldn't speed up the PATCH. Not changed. |
| 17 | tokio runtime | src/bin/main.rs:13 | – | #[tokio::main] sizes the worker pool from available_parallelism, which honours the CPU affinity mask: 4 workers under taskset -c 4-7, 1 per vCPU in a --cpus-limited container. Right as it is. |
| 18 | Allocator | – | mimalloc self time 10–13% of samples, outside the clones | Already mimalloc (+50–66% in docs/BENCHMARK.md). ~550 allocations/request went with fix 1 (below). |
One run hung, early on: right after the /dashboard XHR load, one tokio worker thread stayed at 100% CPU with no load, and later requests got Connection pool timed out (one 500 in the run). It happened once, on the finding-1 build (E1). It didn't reproduce in 12 dedicated runs (6 of E1, 6 of the unchanged 483d902), each checking the server went idle after the load. ptrace is restricted on that host, so no stack could be taken of the spinning thread. The harness now checks after every run that the server's CPU drops (and keeps its log if it doesn't), and the A/B runner gives each run a 300 s timeout. In the 38 A/B runs after that (runs 2–3 and the final before/after, both old and new builds) nothing tripped it, and every response was a 200 or a 303. It's recorded here as unexplained, not fixed. One hit in the E1 build and none in the baseline's runs isn't enough to say whether the change is involved.
The experiments
Each fix and rejected idea was measured as its own build against the one before it:
Run 1 (3 rounds, alternating): before is 483d902, E1 is finding 1, E2 is E1 plus clearing config.settings (finding 4; not committed), and E3 is E1 plus one fallback_service (finding 5; not committed). Load average was 1.49 at the start. Another session's mise shim spun one core on CPU 8 for part of this round, outside both pinned sets, which is why the before range is wide.
| Path | before | E1 | E2 | E3 | CPU µs/req before / E1 / E2 / E3 |
|---|---|---|---|---|---|
/up | 47,005 (44,262–60,073) | 77,345 (49,646–77,925) | 115,285 (89,007–115,913) | 82,632 (81,189–88,840) | 80.8 / 48.3 / 31.5 / 44.5 |
/sign_in HTML | 39,162 (37,890–51,132) | 58,037 (50,496–63,944) | 83,612 (70,805–87,109) | 62,257 (62,178–65,977) | 97.4 / 65.0 / 44.3 / 59.9 |
/sign_in XHR | 41,084 (40,030–53,645) | 56,905 (53,476–67,285) | 85,823 (76,797–86,425) | 66,632 (66,017–69,726) | 92.8 / 66.5 / 43.0 / 55.9 |
/dashboard HTML | 14,069 (13,772–14,182) | 16,090 (14,171–16,453) | 18,410 (16,072–18,637) | 17,782 (16,649–18,636) | 269.3 / 233.9 / 202.5 / 208.1 |
/dashboard XHR | 14,691 (14,253–14,838) | 16,765 (14,648–16,987) | 19,306 (17,925–19,523) | 18,336 (16,544–19,195) | 257.2 / 224.6 / 193.0 / 201.9 |
PATCH profile | 6,699 (5,755–6,702) | 7,075 (7,028–7,098) | 7,628 (7,592–7,630) | 7,110 (6,902–7,605) | 479.3 / 432.7 / 385.8 / 411.7 |
Run 2 (3 rounds, alternating; host quiet, only the server under test and oha busy): E1 again, E4 is E1 plus bundled SQLite compiled with SQLITE_ENABLE_QPSG (another way to fix finding 2; not committed), and E5 is E1 plus cached cookie keys (finding 3).
| Path | E1 | E4 (QPSG) | E5 (keys) | CPU µs/req E1 / E4 / E5 |
|---|---|---|---|---|
/up | 76,455 (71,632–76,986) | 75,207 (75,072–75,268) | 79,200 (78,853–80,703) | 47.8 / 48.2 / 45.6 |
/sign_in HTML | 63,941 (63,869–64,548) | 63,448 (63,446–64,058) | 66,631 (66,619–67,017) | 58.2 / 58.4 / 55.7 |
/sign_in XHR | 65,953 (65,924–66,503) | 66,201 (65,561–66,675) | 69,153 (68,553–69,513) | 55.4 / 55.5 / 52.8 |
/dashboard HTML | 17,584 (17,527–17,601) | 29,992 (29,356–30,023) | 17,763 (17,699–17,800) | 214.5 / 127.7 / 212.7 |
/dashboard XHR | 18,286 (18,120–18,340) | 31,578 (31,384–31,856) | 18,525 (18,504–18,698) | 205.4 / 121.3 / 203.8 |
PATCH profile | 7,657 (7,611–7,719) | 9,157 (9,058–9,241) | 7,715 (7,656–7,811) | 397.2 / 329.5 / 394.0 |
The key cache is small but consistent: every E5 range sits above E1's.
Run 3 (3 rounds, alternating; noisier, since the loco-rs build had started on cores 8–11, which share the L3 with the app's cores 4–7): E4 (QPSG) against E6, which is E5 without QPSG and with the session lookup reading its row without a LIMIT, the app-side fix that was committed.
| Path | E1 | E4 (QPSG) | E6 (no bound LIMIT) | CPU µs/req E1 / E4 / E6 |
|---|---|---|---|---|
/dashboard HTML | 15,713 (14,535–15,801) | 23,284 (21,407–27,013) | 25,275 (23,180–25,797) | 240.0 / 162.0 / 152.3 |
/dashboard XHR | 14,327 (13,474–18,250) | 24,101 (17,245–29,487) | 29,652 (27,912–30,684) | 261.2 / 157.7 / 129.9 |
Why app-side and not QPSG
Both fix finding 2 about equally well. But the compile flag (LIBSQLITE3_FLAGS=-DSQLITE_ENABLE_QPSG) only reaches the bundled SQLite: an app that links a system SQLite doesn't get it (Arch's 3.53.4 isn't built with it). QPSG also changes planning for every query, since the planner stops looking at bound values, so a LIKE ? with a constant prefix can no longer use an index. Not binding a LIMIT on unique-key lookups has neither problem, works on any SQLite, and a test guards it.
Build time: bundled vs system SQLite
A side question: would linking the system SQLite (LIBSQLITE3_SYS_USE_PKG_CONFIG=1) instead of compiling the bundled sqlite3.c speed up builds? Measured on the same host, 16 jobs on our 16 logical CPUs, libsqlite3-sys built alone:
| bundled | system | saved | |
|---|---|---|---|
| dev profile, 3 alternating rounds | 5.7–8.8 s wall, 7.2–10.8 CPU-s | 1.6–1.9 s wall, 3.2–3.4 CPU-s | ~4 s wall, ~4–7 CPU-s |
release profile (sqlite3.c at -O3) | 39.4 s wall, 40.7 CPU-s | 1.7 s wall, 3.3 CPU-s | ~38 s |
A whole clean dev build of the kit takes 49–63 s wall (395–520 CPU-s) either way; the difference is lost in the noise. And libsqlite3-sys rebuilds whenever the variable changes (it's rerun-if-env-changed), which costs 22–27 s wall and 32–38 CPU-s on each switch. So setting it in bin/dev alone would cost more than it saves for anyone who also runs a bare cargo test. The only setup where it pays off is LIBSQLITE3_SYS_USE_PKG_CONFIG=1 exported permanently in your shell, and even then it only matters for release builds. The kit doesn't set it: release builds, Docker and CI use the bundled SQLite, so production runs one known version.
Before and after
483d902 (before) against the three fixes (after), release builds of both. 5 rounds, alternating which build goes first. App on cores 0–3, oha on 4–7,16–19 (see the CPU layout above); only 200s (and 303s for the PATCH).
| Path | before req/s | after req/s | after ÷ before, per round | CPU µs/req before → after | CPU/request after ÷ before, per round |
|---|---|---|---|---|---|
GET /up | 46,944 (38,316–75,400) | 69,917 (61,157–75,740) | 1.37× (1.00–1.96) | 80.6 → 50.2 | 0.68 (0.48–0.97) |
GET /sign_in HTML | 41,100 (35,932–54,969) | 55,430 (45,735–65,058) | 1.54× (0.88–1.64) | 92.4 → 64.3 | 0.61 (0.58–1.12) |
GET /sign_in XHR | 42,631 (36,714–53,105) | 59,444 (51,913–84,521) | 1.39× (0.98–2.16) | 89.3 → 59.9 | 0.67 (0.45–1.02) |
GET /dashboard HTML | 16,104 (14,209–17,209) | 32,079 (23,727–38,169) | 2.09× (1.38–2.54) | 235.4 → 119.5 | 0.49 (0.40–0.74) |
GET /dashboard XHR | 15,580 (14,743–16,746) | 30,127 (25,979–39,776) | 2.02× (1.63–2.70) | 241.8 → 127.0 | 0.50 (0.38–0.62) |
PATCH /settings/profile | 8,477 (7,118–9,475) | 8,943 (6,620–9,540) | 0.94× (0.78–1.34) | 328.9 → 237.5 | 0.78 (0.54–1.03) |
"Per round" divides after by before within each of the 5 rounds, then takes the median, so a noisy round moves both sides together. The ranges are wide because a loco-rs build ran on the other L3 throughout (see Method). CPU per request is the steadier signal, and every path's median is lower. The profile PATCH is bound by the SQLite write (one UPDATE with its WAL append under a single writer lock): it uses 28% less CPU per request, but its throughput doesn't move beyond noise.
On the quiet host before the other build started (app on cores 4–7), the same fixes measured separately in runs 1–3 above: /up 47k → 76–79k req/s and /dashboard XHR 14.7–18.3k → 29.7k.
Allocations per request, after (profiling build of the same tree):
/up | /sign_in HTML | /sign_in XHR | /dashboard HTML | /dashboard XHR | PATCH | |
|---|---|---|---|---|---|---|
| allocations, before → after | 1,906 → 1,354 | 2,075 → 1,523 | 2,016 → 1,464 | 2,490 → 1,941 | 2,360 → 1,811 | 2,268 → 1,720 |
| bytes, before → after | 220 → 156 KB | 260 → 196 KB | 252 → 188 KB | 322 → 259 KB | 306 → 244 KB | 307 → 244 KB |
Each path loses the same 548–552 allocations and 62–64 KB: that's the settings JSON clone in the auth layer (finding 1). What's left of the 1,354 on /up is mostly the same clone in the handler state (finding 4).
After the fixes, where the time goes (same buckets as above):
| Bucket | /up | /sign_in HTML | /dashboard XHR | profile PATCH |
|---|---|---|---|---|
Cloning AppContext (now only handler state) | 48.5% | 39.2% | 27.5% | 21.9% |
| SQLite / sqlx / sea-orm | 2.1% | 1.5% | 20.9% | 31.7% |
| hyper, tokio, syscalls, axum routing, drops | 30.5% | 36.2% | 25.9% | 27.3% |
| mimalloc self time, outside the buckets above | 9.6% | 9.2% | 13.5% | 10.9% |
| cookie keys, HMAC, AES (signing and verifying; no more derivation) | 3.7% | 2.7% | 6.7% | 5.4% |
| tracing / request log | 5.5% | 4.3% | 2.5% | 2.6% |
| page JSON + HTML document | – | 5.7% | 2.0% | 0.2% |
These are shares of a smaller total. derive_key went from 4.9% of /up samples (1.8% of /dashboard) to 0. The handler-state clone (finding 4) is now the largest single item on every page that doesn't query the database.
Flamegraphs (open in a browser: hover for names, click to zoom; frames under 2.5% of samples omitted): /up before, /up after, /dashboard XHR before, /dashboard XHR after. In the /dashboard pair, the sqlite3Reprepare → sqlite3Prepare → sqlite3RunParser tower on the sqlx worker thread (left) is gone after.
README numbers
The README and docs/BENCHMARK.md page numbers come from bench/docker-run.sh on a GCP e2-standard-8. They were re-run on 2026-09-29 with these fixes and mimalloc (bench/results-2026-09-29/; docs/BENCHMARK.md, "Changes since the 2026-09-28 run"). The gains above were measured on different hardware with the app pinned to 4 cores and no Docker, so their absolute numbers differ.
Reproduce
# on the benchmark host, in a checkout with public/vite built (npx vite build)
cargo build --release
bench/profile.sh target/release/inertia_rust_starter_kit-cli /tmp/run1   # APP_CPUS, OHA_CPUS, DURATION, PATHS

# stacks and allocation counts, in a scratch copy of the repo:
cp bench/profiling_main.rs src/bin/main.rs && cargo add pprof@0.15 --features flamegraph
CARGO_PROFILE_RELEASE_DEBUG=line-tables-only cargo build --release
cp target/release/inertia_rust_starter_kit-cli ./profiling-bin
PROF_CTL=1 bench/profile.sh ./profiling-bin /tmp/prof
PROF_CTL=allocs bench/profile.sh ./profiling-bin /tmp/allocs
bench/profile_report.py --short /tmp/short /tmp/prof/*.folded
inferno-flamegraph --minwidth 2.5 < /tmp/short/up.folded > up.svg